
The campaign goes out at 9 a.m. Traffic triples by 9:20. Product pages take eight seconds, the cart hangs on “adding to basket”, and a customer sends you a screenshot of a 504. You restart PHP, the shop recovers, and the ad budget has already spent the best hour of the day.
When a PrestaShop store goes slow during a sale, bandwidth is rarely what gave way. Concurrency is. Serving ten shoppers and serving four hundred are different jobs for the same hardware: every uncached page view ties up a PHP worker for its whole lifetime, borrows a database connection or two, and competes for CPU and memory with everything else in flight. On a quiet Tuesday you never reach that ceiling. Twenty minutes into a campaign you are sitting on it.
So the job is working out which layer ran out first. Six candidates cover most incidents: half-configured caching, uncached dynamic pages, database contention, a greedy module inside a hook, hosting bought for average days, and a front end too heavy for real phones. One section each below.
1.0 What actually happens to PrestaShop when traffic spikes
Trace one product page request. Apache or Nginx takes it and passes it to a PHP-FPM worker, and that worker now has a long list of chores: boot the kernel, resolve the controller, fire every hook a module has registered, ask MySQL about prices, stock and cart rules, render the Smarty templates, hand back the HTML. It stays occupied for all of it. The next visitor waits until it finishes.
The number of workers is the ceiling, and it is a hard one. Suppose the pool allows 20 concurrent PHP processes and a product page takes 800 ms to build. Roughly 25 pages a second is all you get, whatever your bandwidth allowance says. Send 60 a second at it and the surplus queues, ages, and eventually trips max_execution_time or the proxy’s read timeout. That is when people start seeing 502s and 504s.
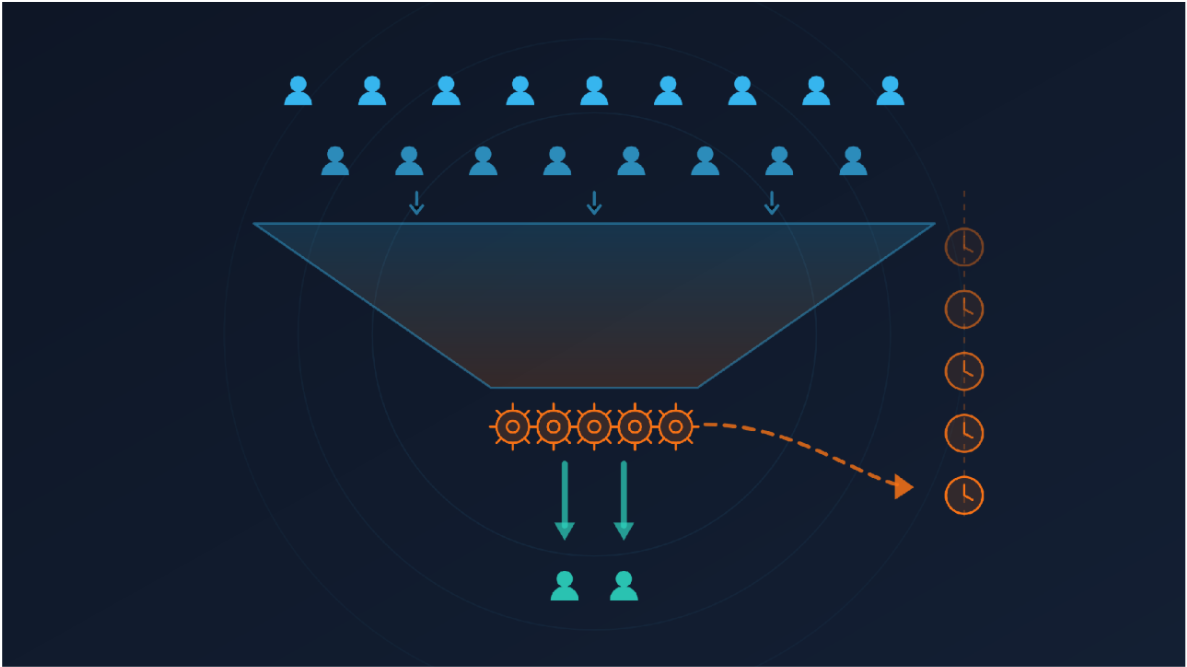
The unpleasant part is that it feeds itself. Slow pages hold workers longer, the queue lengthens, pages slow further, and shoppers tired of waiting hit refresh, adding load on top of the load that caused the wait. Shops do not degrade gently during sales. They look fine, and two minutes later they are gone.
Time to first byte is the number to watch through all of this. jPresta treats a TTFB above one second as a sign that something server-side wants attention, which seems about right. If a quiet Monday already puts you near that mark, nothing is left in reserve for a campaign.
2.0 Checklist: PrestaShop store slow during sale — where to look first
Run down this list before you commit to a theory. Fifteen minutes, and more often than not it hands you the culprit.
- Debug mode: is _PS_MODE_DEV_ or the profiler still on from your last investigation?
- Smarty: does the template setting say “never recompile”, or is it recompiling per request?
- CCC: are the CSS and JavaScript caches genuinely enabled?
- Cache backend: anything beyond the filesystem, such as APCu, Memcached or Redis?
- Workers: what is pm.max_children, and how many were busy at peak?
- Slow queries: does the slow query log hold anything from the sale window?
- Modules: did a promotion, countdown or popup module go in for this campaign?
3.0 Cause 1: Caching that looks enabled but isn’t
Start in Advanced Parameters → Performance. Cheapest win in the Back Office, and the page most often left wrong.
Templates become PHP before anything reaches the browser, and how often that happens is a setting you control. The official performance documentation lists three modes; one of them belongs on a shop under load, which is never recompile template files. Pick “recompile if files updated” and every template picks up a filesystem check on every request: survivable at low traffic, wasteful at high. Force compilation is a developer’s setting, and leaving it on through a campaign rebuilds identical templates a few thousand times for nothing.
Two more things live on that screen. Debug mode prints stack traces and switches off optimisations, so production wants it off, always. The toggles for disabling non-PrestaShop modules and all overrides exist for diagnosis; they are not settings you ship.
4.0 PrestaShop caching CCC configuration worth checking before a sale
The three C’s are combining, compressing and caching, and the effect is fewer and smaller asset files that PrestaShop stops rebuilding on every hit. Turn the CSS side on; it rarely causes trouble. The JavaScript side earns a staging run first, since merging files changes their execution order and some modules dislike that intensely. Better to find out on a Thursday than mid-checkout on Black Friday.
Worth knowing: HTTP/2 multiplexing handles a pile of small files without much complaint, so combining them buys less than it used to. Minification and long browser cache lifetimes still earn their keep.
The cache backend is the last piece on that screen. Filesystem is the default and it holds up until volume arrives. APCu suits a single server, Memcached several, and Redis handles sessions and object caching well. All of them read from memory instead of disk, and under concurrency that gap widens fast.
5.0 Cause 2: Nothing caches your dynamic pages
Everything in Cause 1 makes a page cheaper to build. None of it stops the page being built. PHP still boots, the queries still run, and the HTML still gets assembled for every visitor, including the two thousand who all arrive on the same discounted category page inside the same minute.
Full-page caching answers that. Park a reverse proxy ahead of the web server (Varnish being the usual pick), let it keep the finished HTML, and the next few hundred visitors get served without PHP or MySQL waking up. Responses come back in single-digit milliseconds, and your origin only handles what genuinely has to be computed. On flash sale days that one layer is often the difference between a shop that wobbles and a shop that falls over.
It comes with rules you cannot bend:
- Session-specific routes stay out. Exclude cart, checkout, login and account pages, or shoppers will eventually see somebody else’s basket. Every team that has run a full-page cache badly has this story.
- Decide invalidation before launch. Work out what purges an entry when a price or stock level moves, then test the purge. Serving yesterday’s price mid-promotion costs trust and a morning of support tickets.
- Use ESI for the small personalised bits such as cart totals or a customer’s name, so one dynamic block does not disqualify a whole page.

Spikes get absorbed best in layers. The browser holds what it can, a CDN takes static files, the proxy handles HTML, Redis or Memcached answer repeat questions, and the database gets involved only when nothing above it could answer. Plenty of shops have the first layer and the last one, nothing in between.
6.0 Cause 3: The database is where the queue actually forms
Workers pile up because each one is waiting on MySQL. Cart and order tables never shrink, so ps_cart, ps_cart_product, ps_orders and ps_order_detail are carrying their heaviest load at exactly the moment checkout gets busy. PrestaShop database optimization for traffic spikes is mostly these four jobs:
- Get the slow queries from the log, not from intuition. A default long_query_time of ten seconds is useless for retail, so lower it. jPresta reckons anything past 100 ms deserves a look, and that database time above half the page time is a warning. The profiler tells the same story per hook; scope it to your IP in config/defines.inc.php so shoppers never see it.
- Feed the buffer pool. InnoDB keeps data and indexes in RAM when you give it room. On a dedicated database box, roughly 70–80% of memory keeps the hot cart and product pages off the disk.
- Prune what is safe to prune. Expired guest sessions, old connection logs and stale search statistics bloat tables and slow every scan over them. Monthly cron, not a panic on sale morning. Carts and orders are business records, so archive rather than delete.
- Do not count on the query cache. MySQL 8.0 dropped it, so if your mental model still includes a database that quietly remembers repeated queries, update it. Redis or Memcached carry that job now.
One more thing that catches people: max_connections. Set it below your worker count multiplied by the connections each request opens and you get “too many connections” at peak. It reads like a crash. It is arithmetic.
7.0 Cause 4: A module doing expensive work inside a hook
Sales are when new modules get installed, which is why this category dominates sale-day post-mortems.
Hook code runs on every render, so whatever it does gets multiplied by traffic. A countdown module checking active promotions for each product in a 48-item listing. A “recently viewed” widget writing a row per page view. A stock-alert module calling an API with no timeout. Each turns one page request into dozens of operations, unnoticed at ten visitors and obvious at four hundred.
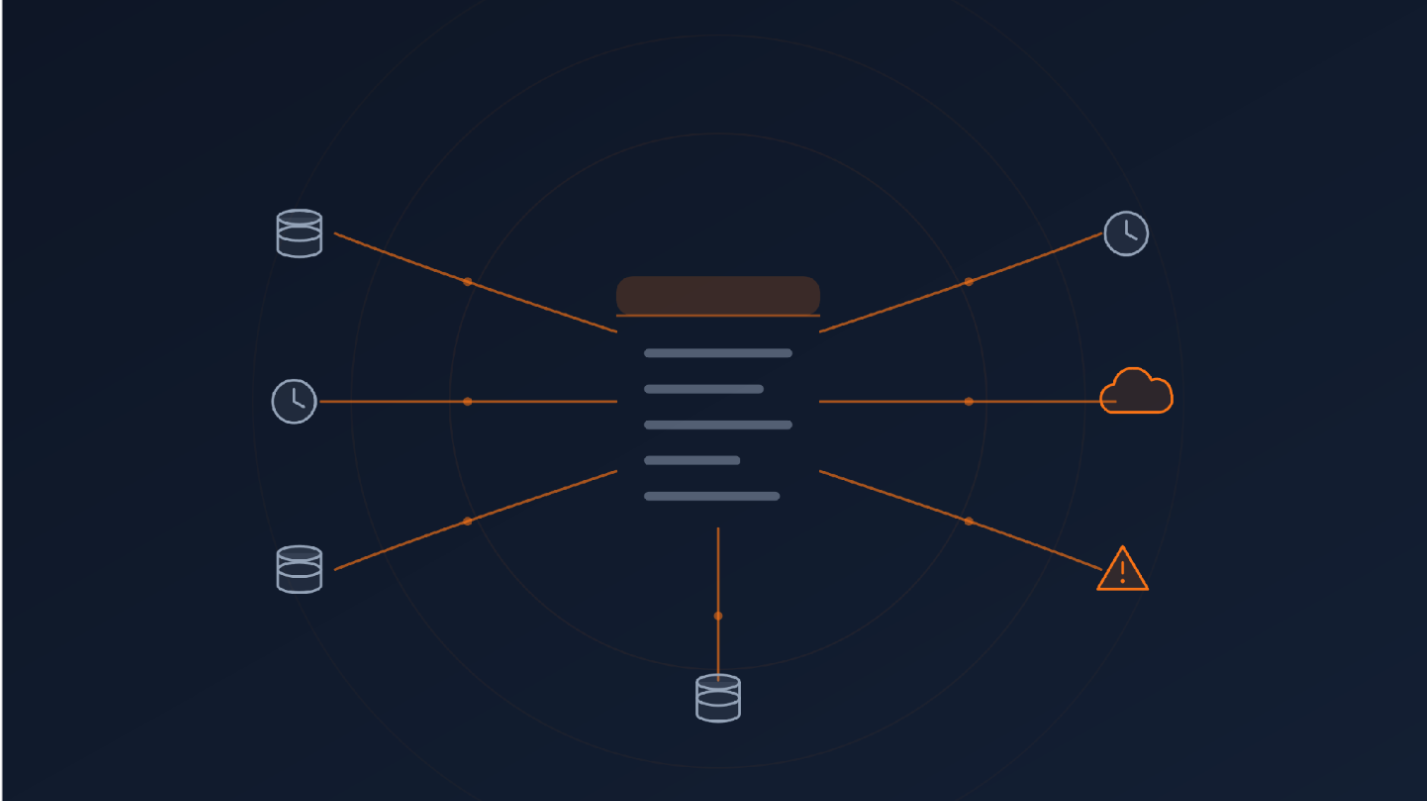
Outbound calls are the nastiest version. A module talking to a third-party service synchronously sits there waiting when that service has its own bad afternoon, and your workers wait with it. Twenty workers stuck behind a five-second API call is a closed storefront, whatever the CPU graph says.
Finding the culprit is bisection work. On a staging copy, switch off the non-PrestaShop modules, confirm the page got quicker, then bring them back in batches until the cost returns. The profiler shortens this a lot, since it reports query counts and timings per hook instead of leaving you to infer them. hiddentechies and jPresta land in the same place: pruning modules nobody uses buys back more than most tuning work.
8.0 Cause 5: Hosting sized for an average day
Shared hosting copes fine with steady traffic. It fails during sales structurally: you share CPU, memory and I/O with neighbours, and providers throttle whatever spikes. A discount campaign is one long spike.
Four things to check:
- PHP version and OPcache. Newer PHP releases are meaningfully quicker than the 7.x line, and OPcache holds compiled bytecode in shared memory so the interpreter stops re-reading your files. Check it is enabled, then check its memory allocation, since the defaults were not written for a codebase this size.
- PHP-FPM pool sizing. Work pm.max_children out from measured per-worker memory, not from a blog post. Set it low and requests queue while the CPU idles. Set it high and the box swaps, which hurts more.
- Server configuration sanity. The PrestaShop project’s php-ps-info script will tell you whether your PHP and web server settings match what your version expects.
- Headroom. TTFB still over a second after all that tuning means you are simply out of hardware. A VPS or managed PrestaShop hosting on NVMe helps, HTML caching in front helps, and doing both helps most.
9.0 Cause 6: A front end that stalls the browser
Capacity and felt speed are two problems, not one. A backend answering in 200 ms still feels broken behind four megabytes of untouched hero imagery. Google’s thresholds work as a scoreboard: 2.5 seconds for largest contentful paint, a fifth of a second for interaction to next paint, 0.1 for layout shift. Campaign pages fail all three at once, because banners, badges, countdown widgets and whatever tags marketing added last week arrive late and rearrange the page while somebody is reading it.
None of the remedies are interesting, which is probably why they get skipped. Compress the images and ship WebP or AVIF. Lazy-load whatever sits below the fold. Give banners and countdowns fixed dimensions so they cannot shove content around. Defer the JavaScript nothing depends on. Then move static files onto a CDN, which shortens the trip for distant shoppers and lifts that bandwidth off your server.
10.0 Reading the evidence after a bad sale day
The record of a bad Friday is still on your server. Work backwards through it.
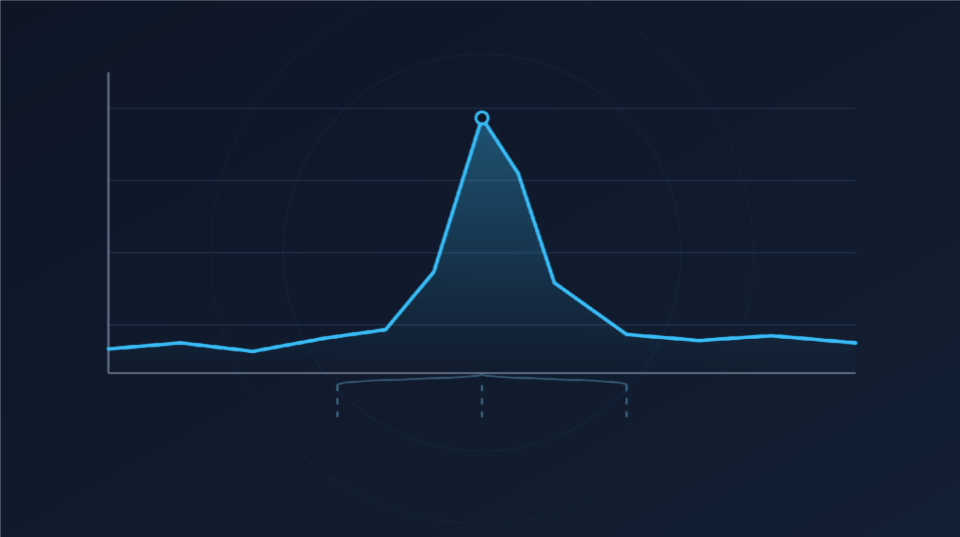
- Build a timeline. Line up access logs, PHP-FPM logs and MySQL logs against the minute traffic climbed. Whichever resource saturated first shows up in that window.
- Read the error, then verify it. A 502 usually means no worker was free or one died mid-request; a 504 means something ran past a timeout. “Too many connections” is the database talking. None of them name a root cause alone, so read them next to the application log.
- Switch on the PHP-FPM slow log. Anything slower than your threshold gets a stack trace naming the function that was still running. Underused, and usually the quickest route to a specific module.
- Check the slow query log for the sale window, sorted by total time rather than worst single execution.
- Keep front-end measurement separate. Lighthouse, PageSpeed Insights, WebPageTest or GTmetrix cover rendering. Mixing that in with server timings is how people end up buying hardware to fix an image problem.
An APM tool turns this from forensics into monitoring, which is the better order to do it in.
11.0 How to prepare for the next sale
A sale is a capacity event that happens to have marketing attached. Plan it that way.

- Write down what normal looks like. TTFB, LCP, cache hit ratio, average database time, all taken on a dull Wednesday. Skip this and every later change becomes an opinion instead of a measurement.
- Load test the staging copy. Drive real peak concurrency at it, add-to-cart included, and note the request rate where errors start appearing. That rate is your actual capacity.
- Freeze the shop before launch. No theme edits, no new modules, no upgrades in the last few days. Deployments clear caches, and a cold cache minutes before opening is the worst possible timing.
- Warm the caches and pre-generate images for campaign pages after the final deploy, so visitor number one gets a hit instead of building the entry.
- Watch it while it runs. Worker saturation, cache hit ratio, database connections, error rate. Spotting trouble in minute two beats hearing about it in minute forty.
- Decide the degradation plan now. A recommendation block, live stock counters, a heavy layered filter: know what you can turn off to shed load without shutting the shop.
Step five is the one people skip, and then they hear about a slow sale from a customer email. Pick two or three numbers you will genuinely watch, and decide where: a dashboard, an APM view, or a terminal with the logs running. You are buying a shorter distance between “this feels slow” and “it is the database”, and during a campaign that distance gets measured in lost orders.
12.0 Where that leaves you
A PrestaShop store slow during a sale is a capacity problem with a short suspect list. Traffic pushed something past a limit you had never reached before, and it is usually half-finished caching, uncached dynamic pages, a database doing more work than it needs to, a module misbehaving inside a hook, hosting sized for average days, or a front end built without mobile in mind.
Work down that list in order, since the cheap items sit at the top. Smarty set to never recompile, CCC on, cache moved into memory, debug mode off: that is one afternoon, and it changes what your existing server can absorb. Load test afterwards, so the next campaign starts from a number rather than optimism.
If you do one thing this week, open the slow query log next to the Performance page and work through the checklist above. Whatever surfaces there is what will bite you next time, and it is far easier to deal with on a quiet Tuesday than at 9:20 on launch morning.
If you have questions or need assistance with your website performance or migration, our experts are here to help. Contact the Knowband team at [email protected] today for reliable ecommerce plugins tailored to your eCommerce needs.


